Wireshark
Wireshark is a very powerful and popular network analyzer for Windows, Mac and Linux. It’s a tool that is used to inspect data passing through a network interface which could be your ethernet, LAN and WiFi.
The series of data that Wireshark inspects are called ‘Frames’ which includes ‘Packets’. Wireshark has the ability to capture all of those packets that are sent and received over your network and it can decode them for analysis. When you do anything over the Internet, such as browse websites, use VoIP, IRC etc., the data is always converted into packets when it passes through your network interface or your LAN card. Wireshark will hunt for those packets in your TCP/ IP layer during the transmission and it will keep, and present this data, on its’ very own GUI.
It is important to note that whilst this is an excellent tool for a network administrator that needs to check that their customers sensitive data is being transmitted securely – it can also be used be used by hackers on unsecured networks – such as airport WiFi. Moral of the story at this point is tostay clear of clear text http protocols: that is the best advice we can give. To remedy this we would encourage you to use a Firefox addon called https everywhere or use an SSH or VPN tunnel.
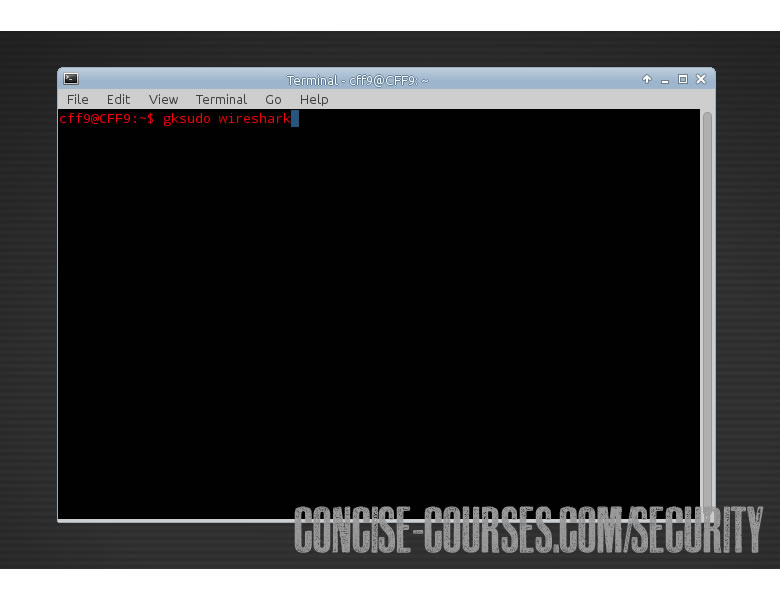
Step 1: Start Wireshark!
To open wireshark in Linux (after you have downloaded it) open it in a terminal with: “gksudo wireshark” – this will open the wireshark GUI. Worth quickly noting that wireshark comes pre-installed with most pentesting Linux distro’s like BackBox and Kali Linux. The “gksudo” command tells your Linux box to open the application, in this instance wireshark, in its’ native GUI whilst in a super-user mode, aka. Sudo.
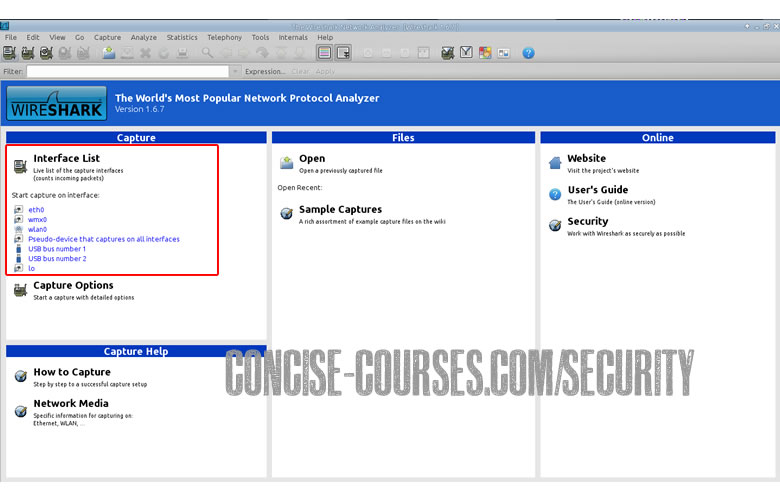
Step 2: Wireshark GUI
Once the wireshark GUI has opened, you’ll see that the dashboard has a left column box called ‘Interface List’. This list lets you know which devices and capture cards you can use. At the top of the application there is an option called ‘Capture Options’ which is exactly that, it allows you to modify and tweak how you would like to capture the packets of data that are being transmitted over your network.
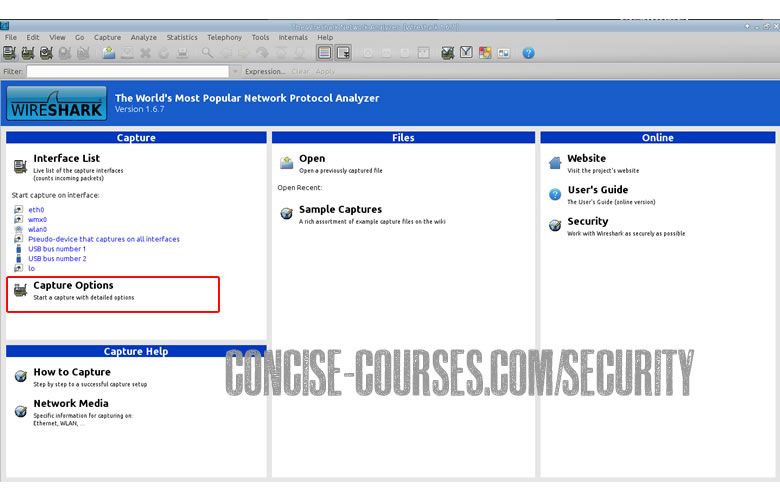
Step 3. Wireshark Interface
If you have a look at your interface list (see Step 2 and the associated screen shot) you’ll see that one of your devices is actually sending and receiving packets. Options include promiscuous mode andcapture mode etc. Have a play around with these and understand what each of these functions does – and you will rapidly learn how to effectively use wireshark.
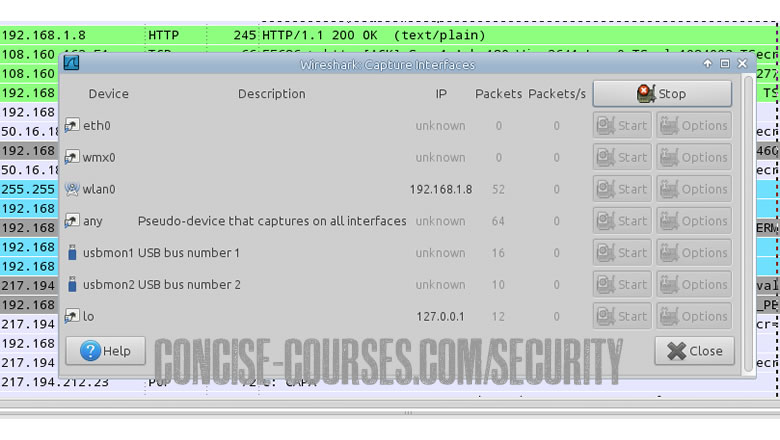
Step 4. Capture Interface Options
This screen shot shows the wireshark capture interfaces, in other words, it shows what processes and platforms are receiving and sending data on your machine. If you have a wireless card, then it will show it, etc.
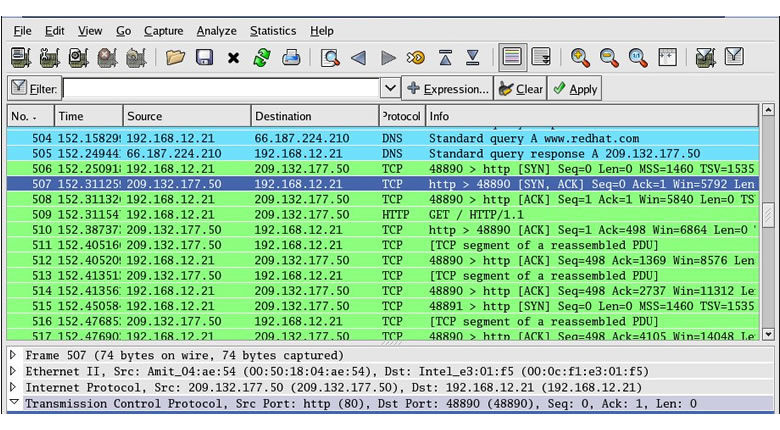
Step 5. The Main Packets Panel
Once you are happy with the interface you’d like to use, go ahead and click ‘start’ and wireshark will show all the packets that are being transmitted over your network. If you open a web browser or for exampl,e watch a video on YouTube, you’ll notice a sudden surge of packet data. The whole point here is to find patterns or anything that looks suspicious. Taking the columns at the top of the wireshark interface from left to right, the first number is the ‘packet number’. The second column shows how many seconds it has been since the start of the capture. The third column is the source IP Address and the fourth column shows the destination IP Address. The fifth column is the protocol that sent the packet, i.e. it could be DNS, TCP (Transmission Control Protocol) or even HTTP.
Filtering the packets is key when using wireshark – done by using the search bar within the interface (top left). If you right click on a packet of interest you can ‘follow TCP stream’ and you get a ton of raw information.
To open wireshark in Linux (after you have downloaded it) open it in a terminal with: “gksudo wireshark” – this will open the wireshark GUI. Worth quickly noting that wireshark comes pre-installed with most pentesting Linux distro’s like BackBox and Kali Linux. The “gksudo” command tells your Linux box to open the application, in this instance wireshark, in its’ native GUI whilst in a super-user mode, aka. Sudo.
Step 2: Wireshark GUI
Once the wireshark GUI has opened, you’ll see that the dashboard has a left column box called ‘Interface List’. This list lets you know which devices and capture cards you can use. At the top of the application there is an option called ‘Capture Options’ which is exactly that, it allows you to modify and tweak how you would like to capture the packets of data that are being transmitted over your network.
Step 3. Wireshark Interface
If you have a look at your interface list (see Step 2 and the associated screen shot) you’ll see that one of your devices is actually sending and receiving packets. Options include promiscuous mode andcapture mode etc. Have a play around with these and understand what each of these functions does – and you will rapidly learn how to effectively use wireshark.
Step 4. Capture Interface Options
This screen shot shows the wireshark capture interfaces, in other words, it shows what processes and platforms are receiving and sending data on your machine. If you have a wireless card, then it will show it, etc.
Step 5. The Main Packets Panel
Once you are happy with the interface you’d like to use, go ahead and click ‘start’ and wireshark will show all the packets that are being transmitted over your network. If you open a web browser or for exampl,e watch a video on YouTube, you’ll notice a sudden surge of packet data. The whole point here is to find patterns or anything that looks suspicious. Taking the columns at the top of the wireshark interface from left to right, the first number is the ‘packet number’. The second column shows how many seconds it has been since the start of the capture. The third column is the source IP Address and the fourth column shows the destination IP Address. The fifth column is the protocol that sent the packet, i.e. it could be DNS, TCP (Transmission Control Protocol) or even HTTP.
Filtering the packets is key when using wireshark – done by using the search bar within the interface (top left). If you right click on a packet of interest you can ‘follow TCP stream’ and you get a ton of raw information.
No comments:
Post a Comment